Global exports are concentrated in a few major economies, led by China, the U.S. and Germany, but several larger developing countries and even smaller emerging economies have made great strides in their export performance in recent years. This creates opportunities for astute global supply chain managers to optimise value via effective global procurement in a dynamic global trade setting.
Highlights:
- Global merchandise trade dropped in 2020 but rebounded in 2021 and 2022 before receding in 2023, partly due to political factors.
- China, the U.S., Germany, the Netherlands and Japan dominate global exports, accounting for almost 40% of the global total.
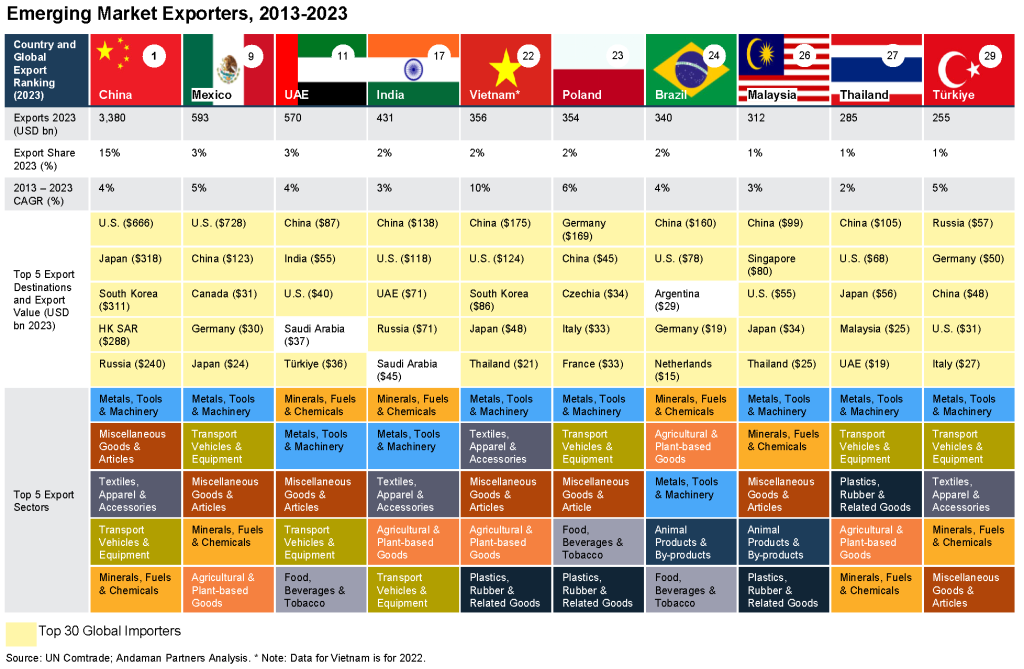
- Among the major economies, several developing countries and emerging markets have steadily climbed the export rankings in recent years, notably Mexico, the UAE and India. Vietnam, Poland, Türkiye, Brazil and Malaysia recorded the fastest export growth rates.
- Outside the top 30 global exporters, smaller emerging economies in Eastern Europe, Africa and Asia reported double-digit export growth.
- Metals, Tools & Machinery dominates global exports, accounting for almost 40% of the total. However, an array of other categories also presents an opportunity for value by tapping alternative supply markets.
Global merchandise trade volumes dropped in 2020 due to the COVID-19 pandemic, as widespread cross-border restrictions and logistical disruptions contributed to a decline in global demand. In 2021, the value of global trade rebounded due to recovering global demand and rising commodity prices. According to UNCTAD data, trade increased by USD 5.5 trillion in 2021 to reach about USD 28 trillion and increased further to a record high of around USD 32 trillion in 2022.
In 2023, global trade dropped by about USD 1.5 trillion (4.5%) to USD 31 trillion, mainly due to lower demand in developed economies, underperforming East Asian economies and decreasing commodity prices.
Political factors played a role in shaping global trade patterns in 2022. There was a noticeable rise in the political proximity of trade since the latter part of the year, indicating a shift in bilateral trade preferences towards countries with similar geopolitical stances (e.g., “friend-shoring”). At the same time, there was an overall decrease in the diversification of trade partnerships and a concentration of trade within significant trade relationships. Global trade was also severely affected by the war in Ukraine, resulting sanctions imposed on the Russian Federation and friction in the U.S.-China trade relationship.
By mid-2024, UNCTAD reported global trade trends turning positive again. If these trends persist, global trade in 2024 could reach close to USD 32 trillion, though it is unlikely to surpass the record level of 2022.
The positive trends are underpinned by positive trade dynamics for the U.S. and developing countries, particularly the strong export performance of the largest Asian developing economies. Moderating global inflation and improving economic growth forecasts suggest a reversal of the downward macroeconomic trends that have characterized most of 2023.
Additionally, rising demand for products related to energy transition and artificial intelligence should contribute to trade growth through 2024. However, global trade remains vulnerable to several downside risks, including geopolitical tensions, rising shipping costs, and increases in subsidies and trade-restrictive measures.
Export rankings and trade relationships
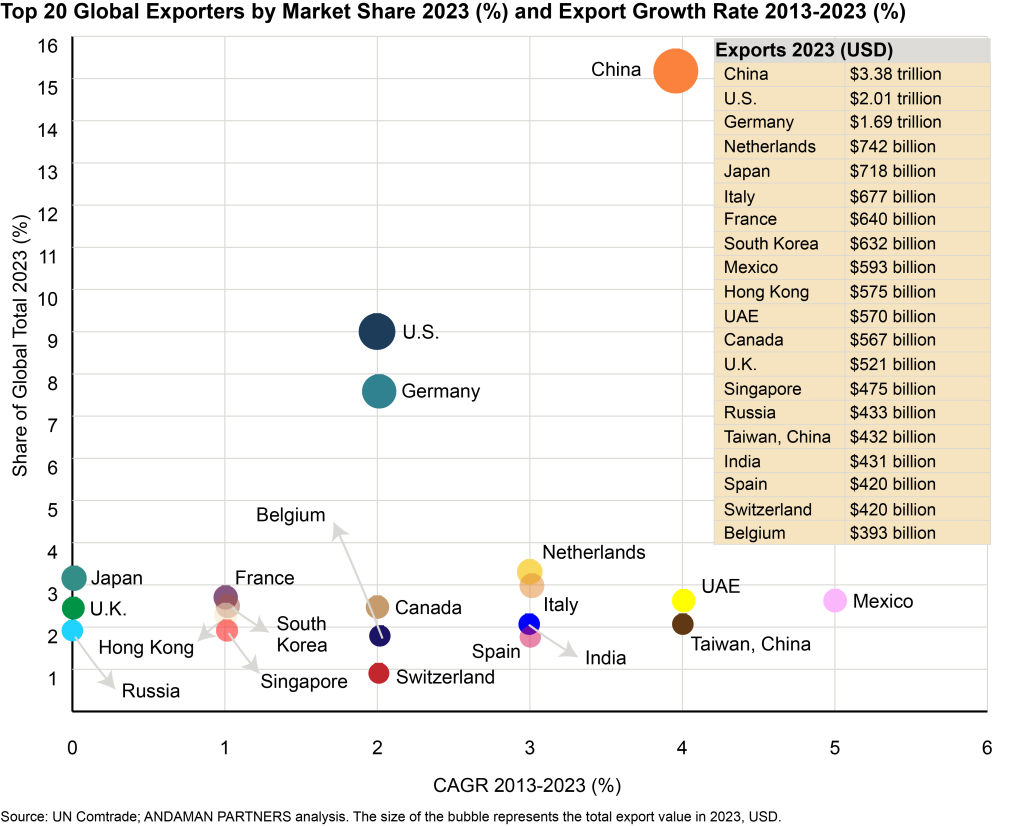
China, the U.S. and Germany have remained the world’s three largest exporters for nearly two decades, and China became the world’s largest exporter in 2009, surpassing Germany. According to UN Comtrade data, in 2023, China’s exports amounted to USD 3.38 trillion, accounting for 15% of global exports totaling USD 22.09 trillion. U.S. exports were USD 2 trillion, 9% of the global total, and Germany’s were USD 1.69 trillion, 8% of the total. Rounding out the top five exporters were the Netherlands with USD 742 billion and Japan with USD 718 billion. These five countries accounted for 39% of global exports in 2023.
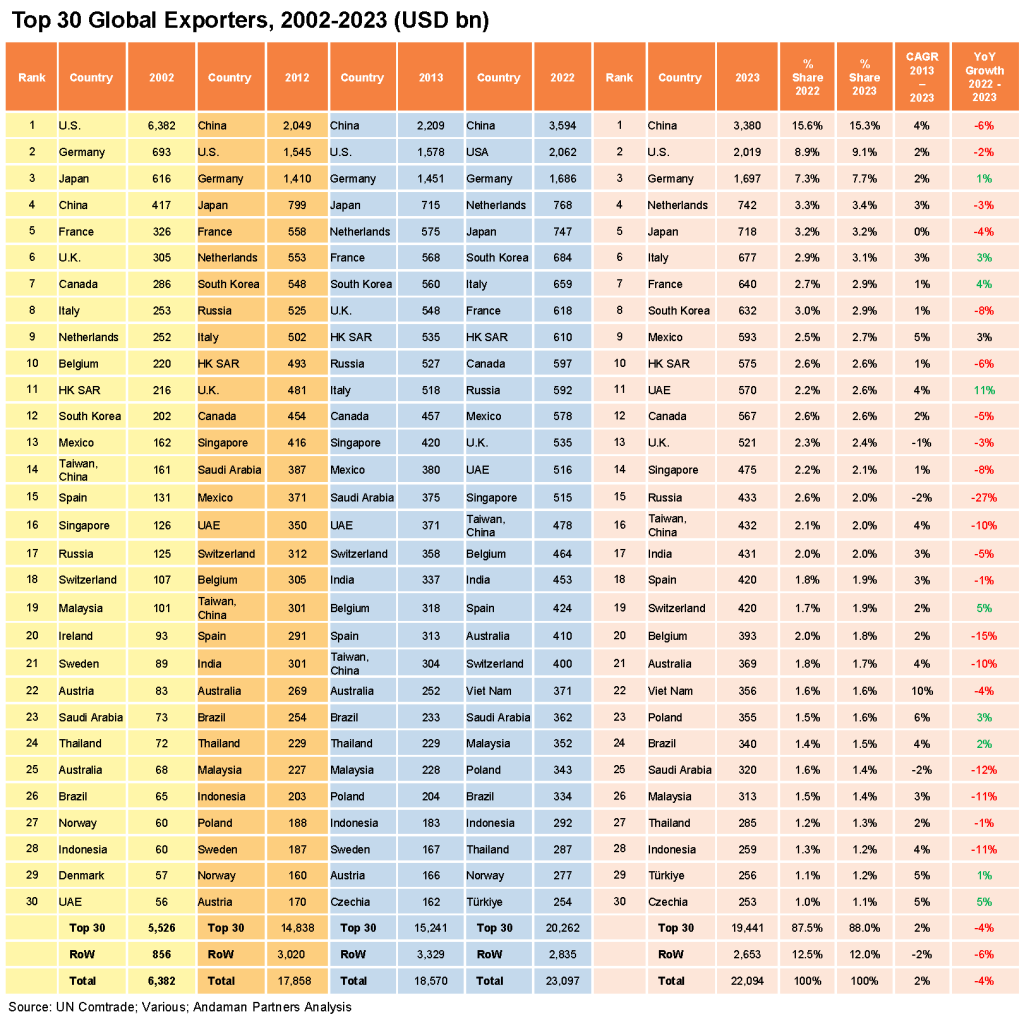
Rounding out the top ten are Italy (USD 677 billion), France (USD 640 billion), South Korea (USD 632 bn), Mexico (USD 593 billion) and Hong Kong (USD 575 billion). Several emerging markets have steadily climbed the export rankings in recent years, notably the UAE (reaching 11th place in 2023), India (17th) and Vietnam (22nd).
In terms of a regional breakdown, in 2023, the G7 accounted for 36% of global exports, followed by the EU (30%) and BRICS (17%), and the Rest of the World with 12%.
From 2013 to 2023, the Netherlands, Italy, Mexico, the UAE, Taiwan (China), India and Spain increased their rankings among the top 20 exporters list. India entered the top 20 in 2013 and moved up one spot to 17th in 2023, while the most prominent climbers were the UAE (16th to 11th) and Mexico (15th to 9th). Japan, France, South Korea, the U.K., Singapore, Switzerland and Belgium dropped a few places over this period, while Saudi Arabia fell out of the top 20.
From 2013 to 2023, the top 20 exporters recorded a compound annual growth rate of 2%, and Rest of World, 1%. Among the top 20, Mexico (5%), China (4%), the UAE (4%), Taiwan, China (4%), India (3%), the Netherlands (3%) and Spain (3%) exceeded this growth rate.
Several emerging markets ranked in the top 30 global exporters recorded higher growth rates over this period, led by Vietnam (10%), Poland (6%), Türkiye (5%), Brazil (4%) and Malaysia (4%).
Of China’s total 2023 exports of USD 3.38 trillion, most went to the U.S. (USD 501 billion), Hong Kong (USD 275 billion) and Japan (USD 175 billion). From 2013 to 2023, Chinese exports to Russia and India increased rapidly, from USD 48 billion to USD 118 billion in India and USD 50 billion to USD 111 billion in Russia. This made India and Russia China’s sixth and seventh-largest export destinations, respectively.
In 2023, China was the leading export destination for Brazilian exports, while the U.S. was the leading destination for exports from Mexico, India, Vietnam and Thailand. Most of the UAE’s exports went to Saudi Arabia, most of Malaysia’s exports went to Singapore, and most of Poland and Türkiye’s exports went to Germany.
Outside the top 30 global exporters, several smaller emerging economies reported the fastest-growing exports from 2013 to 2023. These included Guyana (23%), driven mainly by oil exports, as well as:
- Eastern European economies whose exports all grew by 8%, notably Armenia (mainly gems and precious metals, electrical machinery and equipment, and ores, slag and ash), Serbia (electrical machinery and other equipment), Georgia (copper ore and cars), North Macedonia (chemical goods and electrical machinery) and Slovenia (pharmaceuticals).
- Economies in Asia, notably Cambodia (14%), driven by exports of garments, footwear and agricultural products; and Kyrgyzstan (6%), mainly driven by exports of precious metals and stones.
- Economies in Africa, notably Cabo Verde (15%, mainly processed fish), Uganda (10%, gold), Sao Tome and Principe (9%, cocoa beans and palm oil), Central African Republic (9%, gold and diamonds), Lesotho (9%, garments and diamonds), Mozambique (7%, coal briquettes and raw aluminium), Madagascar (7%, raw nickel and vanilla), Senegal (7%, gold and phosphoric acid), Morocco (7%, chemical fertilizers, vehicles, and electrical machinery), Burkina Faso (6%, gold), Zimbabwe (6%, gold and tobacco) and Benin (6%, raw cotton and gold).
Export sectors
Metals, Tools & Machinery dominates global exports, amounting to USD 8.3 trillion in 2023, or 38% of the global total, up from 36% in 2013. Minerals, Fuels & Chemicals accounted for 20% of the global total in 2023, followed by Miscellaneous Goods & Articles and Transport Vehicles & Equipment, each accounting for 11%.
The shares of Miscellaneous Goods & Articles and Transport Vehicles & Equipment remained relatively constant from 2013 to 2023, but the share of Minerals, Fuels & Chemicals declined from 24% to 20%.
Several smaller export categories increased in value from 2013 to 2023, notably Agricultural & Plant-based Goods, Food, Beverages & Tobacco, Industrial & Specialty Chemicals, and Miscellaneous Goods & Articles.
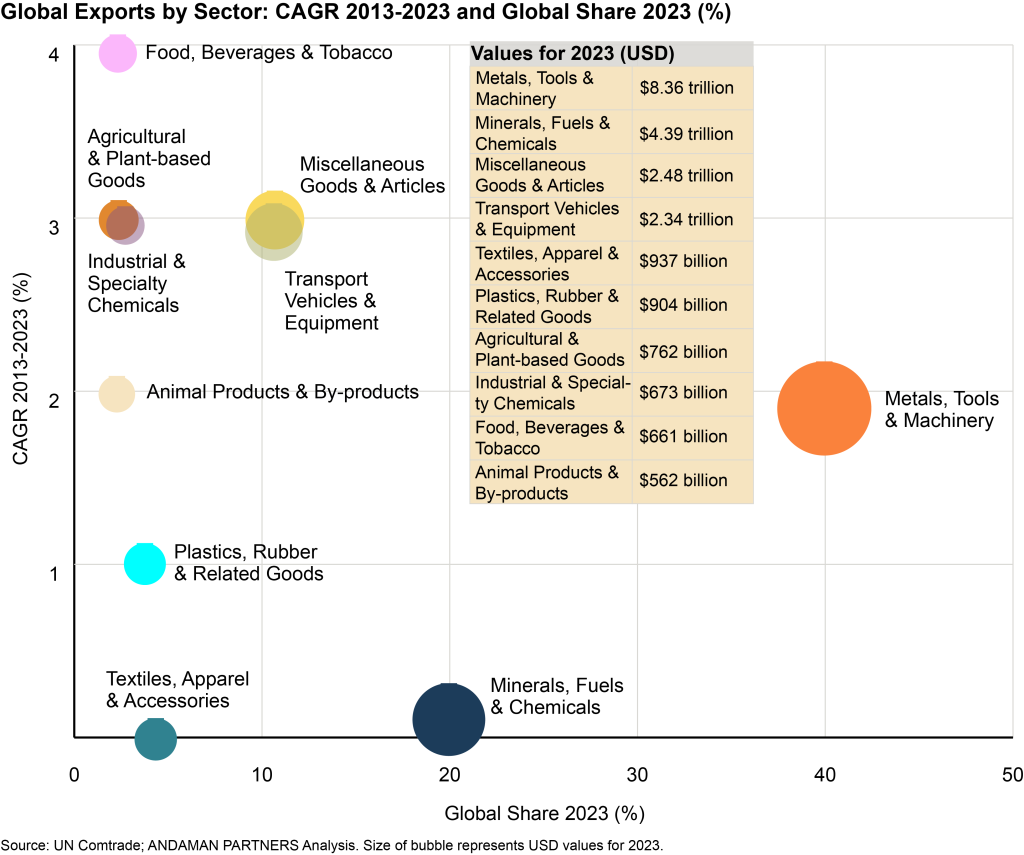
Metals, Tools & Machinery is China’s largest export category, and the same applies to several emerging market exporters, including Mexico, Vietnam, Poland, Malaysia, Thailand and Türkiye. The leading category for the UAE, India and Brazil is Minerals, Fuels & Chemicals.
Metals, tools & machinery are also very prominent in U.S., German, and Japanese exports, but the leading sector for Germany and Japan is transportation vehicles & equipment.
Action list for global supply chain managers
Amid a dynamic global trade picture and shifting trade patterns, supply chain managers must take careful note of the following key actions to remain competitive:
- Build resilient and agile supply chains: Given the real possibility of global disruptions in 2025, companies must build supply chains that will be resilient and able to adapt quickly. Supply chain managers must diversify supplier bases and review options like dual sourcing and nearshoring.
- Seek out new trade opportunities in developing markets: Some of the best trade opportunities are in developing countries and emerging markets, and strategic intelligence is essential to identifying and utilizing such opportunities.
- Anticipate geopolitical risks: Geopolitical tension will likely be a crucial factor affecting trade and supply chains for years to come, so it is imperative to plan ahead and implement alternative supply chain options.
- Put the rights teams and capabilities in place: Develop capabilities for teams to manage long and open international supply chains, paying careful attention to risk management.
- Digitalize supply chains: Implement technology to use data in digital formats to enable technologies like artificial intelligence, blockchain, and cloud-based solutions, identify inefficiencies and reduce costs.